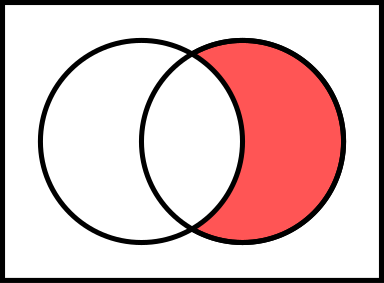
Venn diagrams are tools to summarize in a graphical manner the results of a multifactorial analysis. Outside proper number theory in mathematics, however, they are usually more confusing than elucidating. Actually, I hate them, because people in life-science use them mainly to show how much work they did (but not how much intelligent thoughts they invested).
Here I'd like to suggest (and of course claim trademark ownership for) a couple of special cases of Venn diagrams

The Solar Eclipse diagram
(2 sets with 1 shared set)
The Krupp diagram
(3 sets with 3 shared sets in pairs and 1 shared set for all)
The Audi diagram
(4 sets with 3 pairwise shared sets)
The Olympic diagram
5 main set
7 pairwise shared sets in the overlap between
- blue-yellow
- blue-black
- black-yellow
- green-yellow
- green-black
- green-red
- red-black
3 subsets shared by 3 sets in the overlap between - blue-black-yellow
- green-black-yellow
- green-black-red

No comments:
Post a Comment